HP

HP ProLiant Server Management Packs for Microsoft® System Center Operations Manager 2007 User Guide

English
  HP ProLiant Server Management Packs for Microsoft® System Center Operations Manager 2007 User Guide > Chapter 4 Using the software   

Views

The Operations Manager 2007 Console provides a collection of folders and windows for viewing information stored in the Operations Manager database. The HP ProLiant Server Management Packs for Operations Manager 2007 include predefined HP server views that present information about each HP server and associated alerts.

The following views are added on the Operations Manager Console after successful installation of the HP ProLiant Server Management Packs for Operations Manager 2007:

  • HP Servers--This is the root folder that includes all HP server related views.

  • HP Servers/Active Alerts--This view displays all active alerts generated by Collection classes.

  • HP Servers/Computers--This view displays all HP computers.

  • HP Servers/Group State--This view displays the state view by Groups.

  • HP Servers/Health Collection State--This view displays the state view by Collection classes.

  • HP Servers/HP Management Servers--This view displays the state view of HP management server software such as the HP Systems Insight Manager.

  • HP Servers/Server Diagram--This view displays the diagram view starting with the HP Servers Group.

  • HP Servers/Server State--This view displays the state view for HP servers.

  • HP Servers/Task Status--This view displays the task results. Only remote tasks appear.

    NOTE: There are Integrated Management Log tasks available with ProLiant Server Management Packs. These task statuses display on the Task Status view.

Active Alerts view

The Active Alerts view shows all active alerts associated with HP health collection classes. To display details for an individual alert, select the alert from the Active Alerts pane. The Alert Details pane shows HP Knowledge base text with the originated NT® Event message in the Alert Description.

The predefined event processing rules included with the HP ProLiant Server Management Packs for Operations Manager 2007 are designed to automatically identify and display HP ProLiant server events received in the Windows® Event Log as Operations Manager 2007 alerts.

The following information appears in the alert details:

  • Alert Name

  • Source of Alert

  • Path

  • Alert Rule Name

  • Created Time

  • Alert Description

  • Knowledge

    • Resolution with embedded Console tasks

    • Causes

    • Summary

    • Related Links

The Resolution section contains the following tasks to assist in tool access:

  • HP System Management Homepage

  • HP Integrated Lights-Out

    Product illustration

Analyzing HP alerts

The HP alerts contain server hardware and services information that enable you to identify the cause of an issue and implement a timely and effective response.

The Product Knowledge tab indicates suggested resolutions to the alert. To view full knowledge information, click View additional knowledge from the Alert Details pane. Read the Product Knowledge and take action as described in the Resolutions section. If necessary, launch the Console Tasks defined in the Product Knowledge.

Product illustration

You can use the information in the alert to implement a rapid response and maintain system availability. For additional system data, you can view the HP System Management Homepage on the individual server or use HP SIM to manage multiple systems. Use the tasks provided with the Product Knowledge.

For more information on launching these tasks within the Operations Manager 2007 console, see “Tasks for HP servers.”

Computers view

The Computers view shows all HP computers managed by HP Insight Management Agents, HP Insight Management WBEM Providers, and the hosted Microsoft® applications. This view shows the health state of each computer and you can use Microsoft® tasks as defined in the Microsoft® Computer class.

Product illustration

To view associated HP information, right-click the server entry, and select Open>Diagram View. This view will show the relationship between HP Server and Windows® Computer classes along with other managed classes under the Windows® Computer class instance.

Product illustration

The state of the HP Server class instance will be propagated to the Windows® Computer class instance.

Group State view

The Group State view shows each Server Model Group State propagating from underlying Server Models. To view members of HP Server Group, right-click the group entry, and select Open>Diagram View.

Product illustration

Health Collection State view

The Health Collection State view shows the state of all collections of HP servers. You can view all failed collections at once by sorting the State column.

Product illustration

HP Management Servers view

The HP Management Servers view lists all computers that host the HP Systems Insight Manager (SIM) application for cross-platform hardware resource lifecycle management. The HP ProLiant Server Management Packs for Operations Manager 2007 include a task that enables HP SIM to be launched within Operations Manager 2007.

Product illustration

Server Diagram view

The Server Diagram view provides a graphical display of groups and associated HP servers and subsystems (collections). HP ProLiant servers are displayed in the Server Diagram pane. Expand each icon node to drill down to the next level of information.

Product illustration

Server State view

The Server State view displays the overall status of HP hardware associated with the listed computers. To view detailed state information for HP health collections for a computer, select the computer, and launch Health Explorer from the Context menu or from the link in the Actions panel.

Product illustration

Health Explorer

The Health Explorer can be launched from the State view and the Diagram view. It displays the result of state propagation in folder style. The Health Explorer automatically expands those folders in which red or yellow states are observed. Select the last node in the folder to get knowledge information, and then select the State Change Event tab to view state change history.

Product illustration
Failed Component as "State Property" when using HP ProLiant Servers SNMP Management Pack

The following figure is an example of Health State Change history and state property bag data. The property bag data contains a list of properties with Health State Update and Failed Component information.

Product illustration

The Failed Component information is available by collection monitors:

  • Processor Health Collection: Processor Name

  • Memory Health Collection: Memory Module or Memory Board Name

  • Cooling Health Collection: Fan Type

  • Power Supplies Health Collection: Power Supply Name

  • Realtime Monitoring Collection: Auto Server Recovery

  • Server Others Health Collection: Component Name such as Base System, Threshold Management, Operating System, Non HP Devices, Windows, Appliance, Enclosure, and Other System Health (UID and POST)

Other Health Collections that were not described previously, display N/A to indicate there is no further information available for the failed component. For detailed diagnostic information, launch the HP System Management Homepage.

Failed Component as "Diagnostic script" when using HP ProLiant Servers WMI Management Pack

Diagnostic scripts are run to get component level failure information on an HP ProLiant server. Results of these scripts are intended for debugging failed or warning health monitors in the HP ProLiant Servers WMI Management Pack. These scripts are associated with each HP ProLiant Server WMI Health Monitor and run automatically when the state of a monitor changes.

  • Healthy to Warning

  • Healthy to Critical

  • Warning to Critical

  • Critical to Warning

The following are HP ProLiant Servers WMI Management Pack diagnostic scripts characteristics:

  • All diagnostic script output has information about all the components on the server.

  • All diagnostic scripts only run when a state change has occurred. If a health collection stays in the Warning state for multiple component failures at multiple times (observed with component redundancy sets), the diagnostic script only runs the first time the state change occurs. To see new failed components in such a situation, the script must be manually run. See “Manually initiate diagnostic scripts” for more information.

  • The log collection health monitor does not have diagnostic script.

You can see the output of these scripts from the Health Explorer for a monitor. The following is a sample output of a script.

Product illustration

The following table lists all diagnostic scripts and their associated monitors in the HP ProLiant Servers WMI Management Pack.

ID: Name

Monitor name

Run-on Health state

HewlettPackard.Servers.ProLiant.WMI.ProcessorWarningDiagnosticScript:

HP ProLiant WMI Processor Collection Warning Diagnostic Script

HP ProLiant WMI Processors Collection Health Monitor

HealthWarning

HewlettPackard.Servers.ProLiant.WMI.MemoryWarningDiagnosticScript:

HP ProLiant WMI Memory Collection Warning Diagnostic Script

HP ProLiant WMI Memory Collection Health Monitor

HealthWarning

HewlettPackard.Servers.ProLiant.WMI.CoolingWarningDiagnosticScript:

HP ProLiant WMI Cooling Collection Warning Diagnostic Script

HP ProLiant WMI Cooling Collection Health Monitor

HealthWarning

HewlettPackard.Servers.ProLiant.WMI.SensorWarningDiagnosticScript:

HP ProLiant WMI Sensor Collection Warning Diagnostic Script

HP ProLiant WMI Temperature Sensors Collection Health Monitor

HealthWarning

HewlettPackard.Servers.ProLiant.WMI.PowerWarningDiagnosticScript:

HP ProLiant WMI Power Collection Warning Diagnostic Script

HP ProLiant WMI Power Supplies Collection Health Monitor

HealthWarning

HewlettPackard.Servers.ProLiant.WMI.StorageWarningDiagnosticScript:

HP ProLiant WMI Server

HP ProLiant WMI Server Storage Collection Health Monitor

HealthWarning

HewlettPackard.Servers.ProLiant.WMI.NetworkWarningDiagnosticScript:

HP ProLiant WMI Server Network Collection Warning Diagnostic Script

HP ProLiant WMI Server Networks Collection Health Monitor

HealthWarning

HewlettPackard.Servers.ProLiant.WMI.MPWarningDiagnosticScript:

HP ProLiant WMI Management Processor Collection Warning Diagnostic Script

HP ProLiant WMI Management Processors Collection Health Monitor

HealthWarning

HewlettPackard.Servers.ProLiant.WMI.OtherWarningDiagnosticScript:

HP ProLiant WMI Other Collection Warning Diagnostic Script

HP ProLiant WMI Server Others Collection Health Monitor

HealthWarning

HewlettPackard.Servers.ProLiant.WMI.ProcessorErrorDiagnosticScript:

HP ProLiant WMI Processor Collection Error Diagnostic Script

HP ProLiant WMI Processors Collection Health Monitor

HealthError

HewlettPackard.Servers.ProLiant.WMI.MemoryErrorDiagnosticScript:

HP ProLiant WMI Memory Collection Error Diagnostic Script

HP ProLiant WMI Memory Collection Health Monitor

HealthError

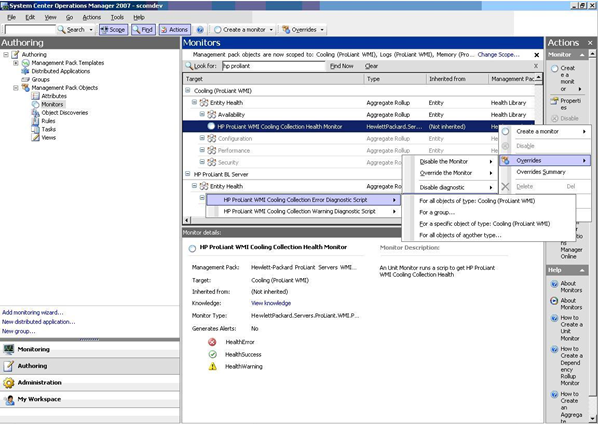
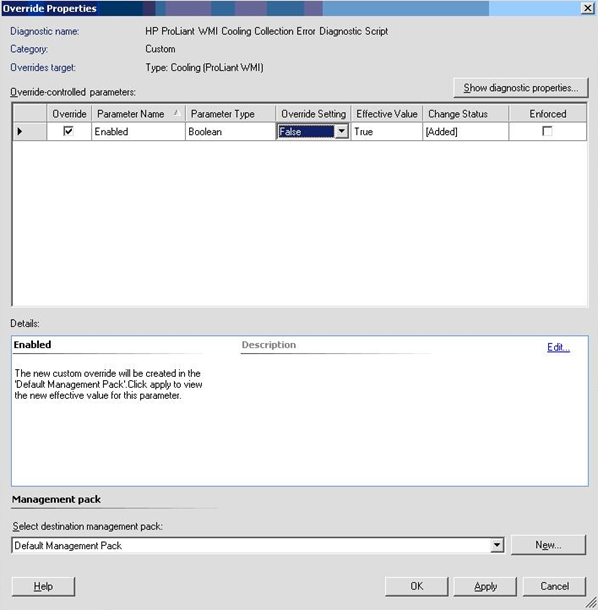
HewlettPackard.Servers.ProLiant.WMI.CoolingErrorDiagnosticScript:

HP ProLiant WMI Cooling Collection Error Diagnostic Script

HP ProLiant WMI Cooling Collection Health Monitor

HealthError

HewlettPackard.Servers.ProLiant.WMI.SensorErrorDiagnosticScript:

HP ProLiant WMI Sensor Collection Error Diagnostic Script

HP ProLiant WMI Temperature Sensors Collection Health Monitor

HealthError

HewlettPackard.Servers.ProLiant.WMI.PowerErrorDiagnosticScript:

HP ProLiant WMI Power Collection Error Diagnostic Script

HP ProLiant WMI Power Supplies Collection Health Monitor

HealthError

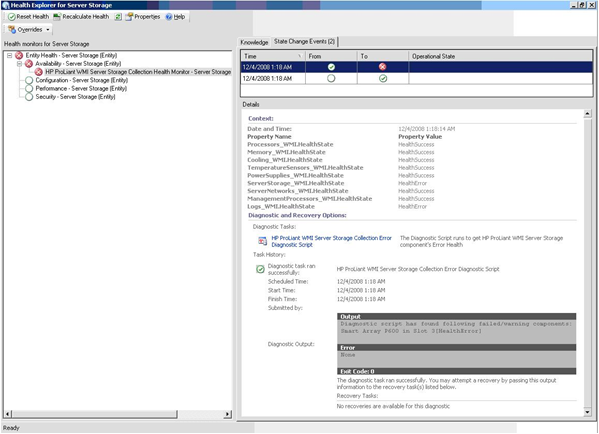
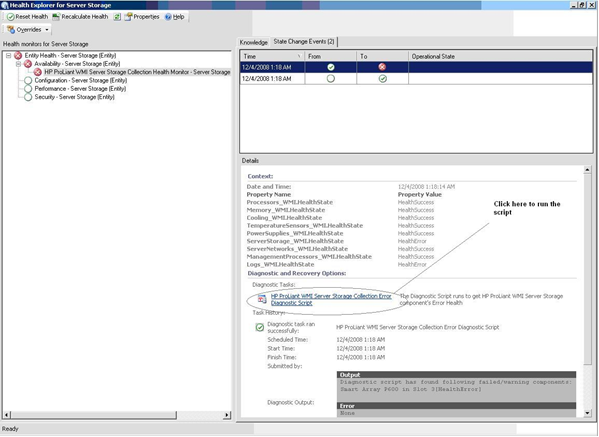
HewlettPackard.Servers.ProLiant.WMI.StorageErrorDiagnosticScript:

HP ProLiant WMI Server Storage Collection Error Diagnostic Script

HP ProLiant WMI Server Storage Collection Health Monitor

HealthError

HewlettPackard.Servers.ProLiant.WMI.NetworkErrorDiagnosticScript:

HP ProLiant WMI Server Network Collection Error Diagnostic Script

HP ProLiant WMI Server Networks Collection Health Monitor

HealthError

HewlettPackard.Servers.ProLiant.WMI.MPErrorDiagnosticScript:

HP ProLiant WMI Management Processor Collection Error Diagnostic Script

HP ProLiant WMI Management Processors Collection Health Monitor

HealthError

HewlettPackard.Servers.ProLiant.WMI.OtherErrorDiagnosticScript:

HP ProLiant WMI Other Collection Error Diagnostic Script

HP ProLiant WMI Server Others Collection Health Monitor

HealthError

Manually initiate diagnostic scripts

Diagnostic scripts are normally configured to run automatically on a state change of any HP ProLiant Server WMI health monitor, but you can choose to manually run it from the health explorer. To manually initiate diagnostic scripts:

  1. Select a monitor and open health explorer.

  2. Select the HP ProLiant Server WMI health collection monitor, and then click the State Changes tab.

  3. Choose any of the above listed state change events, and then click the diagnostic script name.

    Product illustration
    NOTE: The latest data output produced by manually run diagnostic scripts are from the execution process.
Disabling diagnostic scripts by override

Diagnostic scripts can be disabled by using diagnostic overrides. You can choose not to run a diagnostic script by changing the diagnostic script override property from Enabled to False for any HP ProLiant Server WMI Health Collection monitor. You can also override and disable diagnostic script execution on all monitors by repeating the same process on all monitors. You can disable the diagnostic script execution for a monitor on all servers or on a single server. For information on how to create overrides for single server and on all servers, see .”Overriding HP Server management setting for SNMP and WMI management preference.”

To disable diagnostic scripts by override:

  1. Select the HP ProLiant Server WMI health monitor from the Authoring>Monitors screen in Operations Console.

  2. Right click the monitor, and select Overrides>Override Diagnostic. Select the script name, and then select if it is for a specific object or all objects.

    Product illustration
  3. Check the override checkbox, and then select False in the Override Setting for the Enabled parameter.

    Product illustration
  4. Click Apply, and then close the Override Properties window.

Task Status view

Product illustration

WMI view

There is no specific view to the HP ProLiant Servers WMI Management Pack. All views are shared with the HP ProLiant Servers SNMP Management Pack.