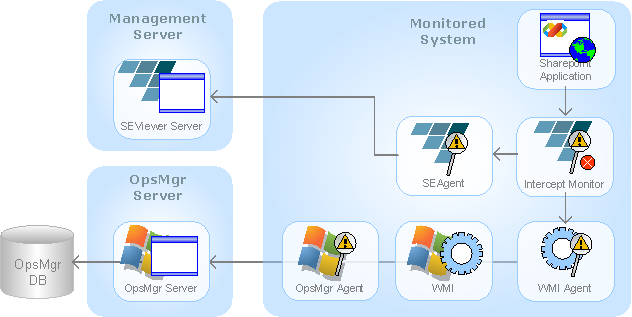
The Management Pack gathers information about SharePoint application performance and exception events. The following diagram outlines how events are routed between each component in the Management Pack.
On this diagram you will see:
 *You can deploy SEViewer Server and the Operations
Manager Server on the same server or the separate servers.
*You can deploy SEViewer Server and the Operations
Manager Server on the same server or the separate servers.
The Operations Manager agent runs on each computer that you want to monitor. Although the Operations Manager Agent may not be needed in order to monitor an application server, it is needed in order to correctly deploy the Management Pack.
The AVIcode Intercept Agent provides the Intercept Operations Monitor, which collects performance and exception information from SharePoint applications.
The Intercept monitor attaches to any SharePoint application on the fly, without any code modifications or recompilation of the monitored application. The Intercept Agent uses standard common language runtime (CLR) mechanisms, so that it will have no behavioral effect on the monitored application.
Intercept Operations Monitor measures application performance so that you can quickly identify and quantify root cause performance problems in a production environment and effectively prioritize your problem resolution efforts. Intercept Operations Monitor allows you to monitor the performance of your application at runtime without modifying your code, and to capture resource specific performance data.
Intercept Operations Monitor collects performance information about the communications of monitored components with external systems, such as SQL servers, Web Services, TCP/IP servers, OLE DB providers and others. It tracks request times for external resource calls, and raises an event if request times exceed predefined thresholds. The performance event information appears in a tree structure, where the root of the tree is the top-level function of a monitored component, and the leaves of the tree are calls to external systems. If the monitored component is a web application, the tree Root node is a page-process request call. If the monitored component is a web service, the tree Root node is a web-service function call. Intercept Operations Monitor also collects the runtime information about external system calls (i.e., query strings and query parameters for SQL calls, function names and function parameter values for web service calls).
Intercept Operations Monitor feeds the performance data into Operations Manager, and into Intercept's own Event Viewer.
The Intercept Management Console provides a convenient way to configure monitored applications in Intercept Studio. It allows system administrators to add applications, to select either performance or exception monitoring, and to set thresholds and options.
Intercept SE-Viewer is a centralized event Management System for enterprise monitoring. Installed under IIS, it uses inputs from the Intercept Operations Monitor to send events to Operations Manager, allowing data center personnel to monitor deployed .NET applications for slowdowns, faults and failures, and immediately pinpoint the source of problems. Intercept SE-Viewer provides root cause diagnosis down to the source-code level without developers having to alter the code.
AVIcode Intercept Visual Studio Plug-in installs onto a developer's workstation, and provides easy integration between Intercept SE-Viewer and Microsoft Visual Studio. To use, a developer drills down the event to the line of defective source code displayed in SE-Viewer, and is then able to open the original source code in Visual Studio.
Last update: Thursday, December 09, 2010 02:05:19 PM