Examples for
performance event details are given for ASP.NET applications and
web services. Note that this information applies to any .NET
components monitored by AVIcode products.
The 'Event Properties' tab provides property information
about the event such as what computer the event occurred on,
the Event Date, etc. The Properties tab also displays event
data that allows you to drill down the call stack, and view
detailed information about function variables.
The properties area displays all non-data related
information about an exception or performance event.
Event Class: .NET Performance
Event
Aspect: Application Failure,
Connectivity, Performance, Security, Operational Info, System
Failure
Component: Win32, COM or .NET
DLL. In development environment library typically corresponds to
Visual Studio Project. It's typically deployed as part of an
application.
Status: Indicates that someone
has applied a rule to a set of events via the 'Rules
Management wizard..', in order to properly triage events. This
value may be 'New', 'Reviewed', 'Behavior by Design' or
'Deleted'
Source: The name of the
application from which Intercept Studio received the event. This
name is also a link which will open the Application Resource
Utilization window for the named application.
Event Date: The date/time stamp
for when an event occurred
Build: The version from the
main assembly of the application, which is automatically
incremented when the assembly is built, and which is stored in
Assemblyinfo.cs)
Computer: The name address of
the monitored computer from which the Intercept Agent generated an
event. This name is also a link which will open the Computers
Resource Utilization window for the named computer.
The event type icon (, , ) is also displayed below the General
Information area and to the right of the tabs to indicate whether
you are looking at a performance event, handled exception or
critical exception. The icon will also display a tooltip with event
ID and event category.
Intercept uses two criteria to determine which nodes are the
slowest. The first is to make sure that the time exceeds a minimum
internal threshold, thus eliminating the normal system load
variations. The second is to ensure that the execution time falls
within a certain percentage of the total run time. Intercept uses
these same factors to consolidate performance events. When an event
occurs because it has crossed the alerting threshold set in the
Management Console, but none of the nodes making up the event meets
the two criteria, then no nodes will appear under 'Slowest Nodes'.
The slowest node is also highlighted in the call stack.
Clicking on any one of the slowest node links will cause the
stack to expand to show the details for that node.
Use the plus ()
symbol to expand structures such as class (), functions (), arrays (), and objects (). The minus () symbol will collapse the information
displayed.
Use the down arrows () to show details related to parameters
and member variables, and the up arrows () to reduce the level of detail
displayed. Dagnosing performance issues only requires
information about the dialog between your application and external
resources.
When you expand a bottom level function call () in the Stack area using the
down arrows (),
SE-Viewer will display a tabbed box that will allow you to
view parameters, member variables and
source code for the expanded function.
Note that slowest node in the execution tree view is highlighted
in red as indicated below:
The 'Execution Tree View' and
'Resource Group View' radio buttons
display Performance Events in two different ways.
Execution Tree View: This view
displays all resource calls in the order in which they were
executed.
Resource Group View: This view
groups resource calls by type (e.g. Oracle, calls to *.ashx,
Sybase, ODBC, SQL, Remoting, Web Services, etc.), provides a count
of the number of calls in each group, and gives the percentage of
total page execution time that this type of call takes up. An
additional row is provided that reports the amount of 'Internal
execution time', which accounts for page execution time not related
to the resource calls.
Where's the
first call the performance stack trace? Because the stack shows
how calls were executed across time, the stack is displayed with
the first function executed at the top, and the last function
executed at the bottom.
Chains allow you to see events from the next connected node in a
distributed performance event.
This symbol
links to details about the next connected event node in the chain
for performance events.
This symbol
links to details about the event node that preceded this
performance event in the chain.
Example:
Event #1688 is from a client running 'questionnairepage.aspx'.
The slowest node in the execution tree (highlighted in red) is a 26
ms web service call to 'GetQuestions()'.
When you click on the Intercept Studio will link to the
corresponding event. No chain link is displayed if there are no
corresponding events.
If there is only one single chain event that corresponds to
this one, then its event details window will open.
If there are several single chain events, the single 'Chaining
Wizard' opens. The single 'Chaining Wizard' will ask you to decide
whether Intercept Studio should make the best possible choice, or
provide you with all possible choices of corresponding events. For
single chains, an event is considered to be a corresponding event
based on the following parameters: full invoking method name, type
of event (exception or performance), invoking method arguments and
the value of ObjectURI for Remoting events (or URI for WebService
events). Once you make your selection from the wizard, you must
click on the link
again.
If there is only one multi chain event that corresponds to this
one, then its event details window will open.
If there are several multi chain events, the 'Multi-request
Chaining Wizard' opens. For multi-request chains, corresponding
events are automatically selected based upon the full invoking
method name and the type of event (exception or performance).
Additionally, users may filter events based on: Computers, sources,
from/to dates and the minimum/maximum event durations. The
minimum/maximum event duration filter is only available for
performance events.
Event #1687 is the server-side event that corresponds to the
'GetQuestions()' call from event #1688. Notice that the call's
execution time was 13 ms.
So what accounts for the difference in time between the
client-side reporting a time of 26 ms for the 'GetQuestions()'
call, and the server-side reporting a time of 13 ms to execute the
'GetQuestions()' call? The difference of 13 ms can be accounted for
by the network transport time and execution time in the ASP.NET
worker process itself.
No performance chains
to the remote server? Be sure to check the synchronization of
times between your servers for each tier so that Intercept Studio
can properly correlate transactions for the chain functionality.
Also make sure that the related events exist on both tiers.
Once you drill down to the bottom frame in a performance event
through the
links, you will see a tabbed area that links you to detailed
information variable in the selected call.
Note that the 'Variables' label on the tab tells you how many
variables there are for this function, in this case two (2). Notice
that by using the plus () symbols that you can drill further into the
details about the variables and their values. The structure column
identifies whether or not each item is a class.
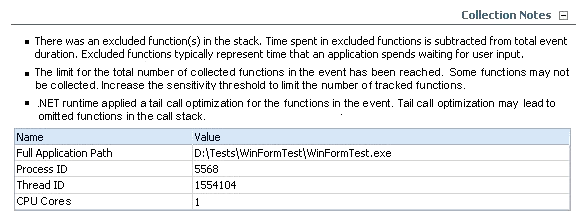
Collection notes provide additional data about any restrictions
that apply to the event. If restrictions are in effect, the
Collection Notes area will be open and visible when the event
details are opened.
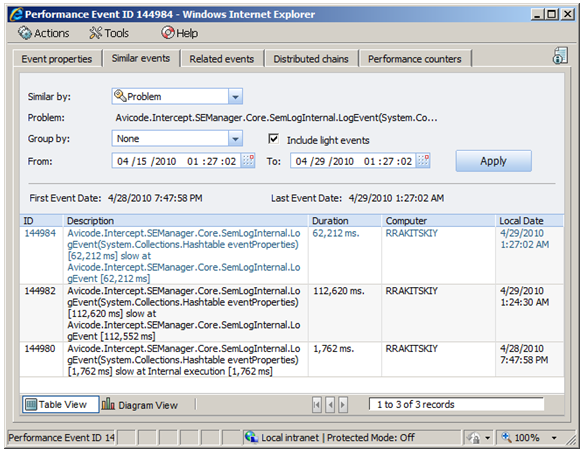
This tab may be used to find similar events that are occurring
in your system. You may filter for identical events or by events
which have the same heaviest resource.
Grouping events by 'Problem' means that all events are identical
and have the same execution tree.
Open the Event Details window for a performance event
Select the 'Similar events' tab
Select
'Problem' from the 'Similar by:' dropdown list
The 'Problem:' field will automatically refresh with the common
root cause
Select the earliest event date that you are interested in the
'From:' date picker ()
Select the latest event date that you are interested in the
'To:' date picker ()
Click Apply
The 'Number of Events:', 'First Event Date:' and 'Last Event
Date' fields will automatically update, and the list area will fill
with the selected events. Each event in the list is a link to that
event's details page.
Click the
'Diagram View' link at the bottom of the page to view a bar chart
which will compare the number of events from this problem against
the number of events from other problems for the selected time
period.
Grouping exception events by 'Heaviest Resource' means that all
events had the same longest running resource call. In some cases,
the similar events will group events where the longest resource was
the internal execution time..
Open the Event Details window for a performance event
Select the 'Similar events' tab
Select 'Heaviest Resource' from the
'Similar by:' dropdown list
The 'Heaviest Resource:' field will automatically refresh with
the name of the resource that executed the longest
Select the earliest event date that you are interested in the
'From:' date picker ()
Select the latest event date that you are interested in the
'To:' date picker ()
Click Apply
The 'Number of Events:', 'First Event Date:', and 'Last Event
Date:' fields will automatically update, and the list area
will fill with the selected events. Each event in the list is a
link to that event's details page.
Click the
'Diagram View' link at the bottom of the page to view a bar chart
which will display the average durations in milliseconds for this
resource for the selected time period. The display will be in days,
months or years depending on the length of the time period.
Open the Event Details window for a performance event
Select the 'Related events' tab
Select the time frame within which the other events must have
occurred relative to the selected event
Click Apply
The 'Number of Events:', 'First Event Date:' and 'Last Event
Date' fields will automatically update, and the list area will fill
with the selected events. Each event in the list is a link to that
event's details page.
The Distributed Chains Tab provides a graphical display of
performance issues as they occur across multiple tiers in a
distributed transaction. Two views are provided for viewing event
chains: Single Transaction and Multi-transaction. Single
transaction chains display how events from a single business
transaction are interconnected. For any single business
transaction, there is no guarantee that events will be generated
from all tiers involved in the transaction, and therefore the chain
may appear to be incomplete. Because of this, Intercept also
provides a multi-transaction chain, that maps event averages
gathered for a transaction across a defined time period.
The properties area displays information about the events
which are displayed in the graphical chain.
Number of Events: The number of
exception nodes displayed in the graph
Chain duration: The total
duration of the performance event as displayed in the event
properties for the primary (left-most) node in the chain
Percent of chain: This number
will be 100% from the left side of the chain. The percent displayed
for each node on the right side of the chain will indicate what
percentage of the total execution time is taken up by that
node.
The chains area displays the graph of performance events that
are related to one another from calling, and called, functions.
Each node in the graph may is a link that may be clicked to open
the event details for that event. The node that is marked with a
blue border is for the event details window currently being
viewed.
This graph is from the details window for the
QuestionnairePage.aspx running on the client-side:
Note that the current node has a blue background, and that the
slowest node is highlighted in red.
This graph is from the corresponding details window for the
QuestionnairePage.asmx.StoreAnswers() function that was called on
the server-side:
Note that the slowest node is highlighted in red, and because it
is also the current node it has a blue background.
If you need to reconfigure the display to fit all of the
graphical nodes onto the window, there are links on the bottom
right-hand side of the window:
: fits the graph
to the window
: resizes the
graph to its default size
: reduce the size
of the picture
Missing nodes in the graph? An
event may display several nodes that all have the icon next to them as in the
following example:
But why does the 'Distributed chains' tab only show the 21 ms
and 5078 ms nodes?:
This is because there is no corresponding event for the 14 ms
node. If you click on the links for that nodes, and you will see the
message "This functionality allows you to correlate this event with
an event from the calling application. Please ensure that the
calling application is monitored, and that a corresponding event
from the calling application is available". Read about the
Multi-Transaction graph for an alternative method of viewing al
nodes in the transaction.
Keep in mind that the single transaction chain will display each
call as a node in the chain, even if there are multiple calls to
the same function. For example, the following stack:
Multi-transaction chains map event averages gathered for a
transaction across a defined time period. This serves two
purposes:
The first purpose is to present a chain that contains all nodes
involved in a business transaction, since a single transaction view
may be missing nodes that did not generate their own events (see
above).
The second purpose is to be able to identify which parts of a
business transaction have been most problematic (from a performance
standpoint) for a particular time period.
Callee: A child function that is called by the current
function.
Caller: A parent function that calls the current function.
Calls: The number of times this function was called.
Call Time: Duration of call (total round-trip time) of a server
method.
Edge: A relationship between two functions where one (caller)
is calling the other (callee).
Edge Time: Time contributed to the total time of a callee
function when called from a specific caller function. The sum of
the edge time of all the incoming edges to a function equals to
this function's total time.
Edge Total Time: The execution time of a particular function
when called from a specific parent function.
Self Time: Time spent inside a function, including time spent
waiting between execution activities. It does not include time
spent in calls to other instrumented functions.
Total Time: Time elapsed between the time a function starts
execution until the time it terminates execution. This is the sum
of this function's Self Time and all its callees Total Time.
Let's assume that you have a web site like Amazon.com for
ordering books and DVDs. The application and its corresponding web
services are monitored for performance, and have generated quite a
few performance events. From one of the performance events we
see the following multi-transaction chain, which was generated for
a two day time period From: 05/01/2007 - To: 05/02/2007. The chain
has 3 nodes: The CALLER, which is an ASPX page, and CALLEEs #1 and
#2, which are the web services being accessed by the CALLER.
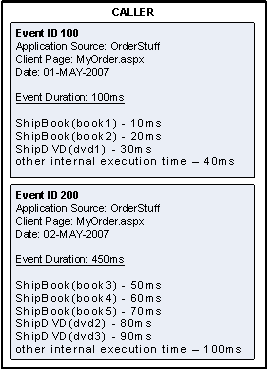
The CALLER node is made up of events that came from
MyOrder.aspx, which makes multiple calls to the ShipBook method (in
CALLEE #1) and the ShipDVD method (in CALLEE #2). For the period
from 05/01/2007-05/02/2007, there are two transactions that
occurred that generated events, and these 2 events make up the
CALLER node. The times displayed in each event are the times that
would appear for web service calls in the Execution Tree View of
the performance events from the MyOrder.aspx page. Note that
these times will be longer that the execution times for the
corresponding web service events, because they include the
transport time.
So the data that we see on the CALLER node is as follows:
MyOrder.aspx
Avg. Total Time: 275.00ms. This is calculated by averaging
Event 100's total event time (100ms) and Event 200's total event
time (450ms). So, (100 + 450) / 2 = 275
Source: OrderStuff
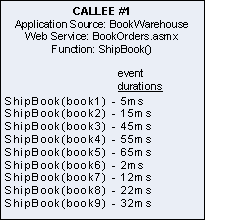
To understand the rest of our example, we need to understand
what CALLEE #1 and CALLEE #2 are doing. CALLEE #1 is a web service
called BookOrders.asmx that is used for shipping books via the
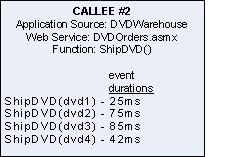
ShipBook method. CALLEE #2 is a web service called
DVDOrders.asmx that is used for shipping DVDs via the ShipDVD
method. The times displayed are for each event from the web
service calls, and correspond to the event times of each web
service performance event. Note that these times will
be shorter that the execution times for the corresponding web
service calls in the CALLER, because they do not include the
transport time between CALLER and CALLEE.
You may have noticed that the CALLEEs have calls to ShipBook and
ShipDVD that did not come from either Event ID 100 or Event ID 200.
That is because there are other applications, outside of our
multi-transaction chain, have also been making calls to the
BookWarehouse and DVDWarehouse web services.
What is the time displayed on arrow (A) that goes from the
CALLER to CALLEE #1? This is the Average Edge Time, which is
calculated as the sum of all ShipBook call times from Event 100 and
Event 200 (or the CALLER) to CALLEE #1 divided by the number
collected events. Therefore, the Average Edge Time is
(10+20+50+60+70)/2 = 105.00 ms.
What data is displayed on the CALLEE #1 node?:
BookOrders.asmx.ShipBook
Avg. Total Time: 275.00ms. This is the sum of all event
durations divided by the number of events. (100 + 450) / 2 =
275.00 ms
Source: BookWarehouse
The next data to look at is in the tool tip for arrow (A)
between the CALLER and CALLEE #1. Note that all arrows between
nodes in the diagram have tooltips. The tooltip contains the
following information:
Avg. Call Time: Sum of call times / Number of calls. This is
calculated as (10+20+50+60+70)/5 = 42.00 ms
Avg. Edge Time (ms): Sum of call times / Number of collected
events. This is also the time that is displayed on the arrow
between nodes in the chain. (10+20+50+60+70) / 2 = 105.00 ms
Avg. Edge Time (%): The formula to calculate the percent
average edge time is (Average Edge Time / Average Total Event Time
) * 100. The result is (105.00 / 275.00) * 100 = 38.18%.
Avg. Number of Calls per Event: Total number of calls / Number
of collected events. This is calculated as (2+3) / 2 = 2.5
Max Number of Calls per Event: 3, because Event ID 200 made the
most calls to ShipBook
Min Number of Calls per Event: 2, because Event ID 100 made the
least calls to ShipBook
Count: 5, the total number of calls made to ShipBook
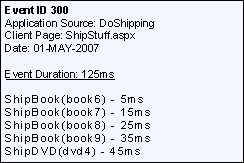
Now let's look at the tooltip data on CALLEE #1. Note that each
node in the diagram has it's own tooltip. Keep in mind that all
calculation will include not only calls from CALLER (Event ID 100
and 200), but also from other applications like DoShipping (Event
ID 300)
Action: /BookWarehouse/BookOrders.asmx.ShipBook
Average Total Event Time (also Avg. Total Time): This is the
sum of all event durations divided by the number of events.
(5+15+45+55+65+2+12+22+32)/9 = 28.11 ms
Average Self Time (ms): This is calculated by adding the
duration of all events generated by CALLEE #1, subtracting the time
spent making calls to any outside resources, and then dividing the
result by the number of events. For the sake of discussion, let's
assume that for each event, 1ms was spent making outside calls,
Therefore the Average Self Time is calculated as:
((5+15+45+55+65+2+12+22+32) - (1+1+1+1+1+1+1+1+1)) / 9 =
21.00 ms
Average Self Time (%): Average Self Time / Average Total Event
Time * 100. In this example, the value would be (21.00 /
28.11) * 100 = 75%, which means that 75% of the event time was
spent on internal execution rather that outside resource
calls.
Count: How many calls were made to this function over the
selected time period. In this example, the count = 9
Raised in Sources (also Source): The name(s) of the monitored
applications that the events were generated from, which is
BookWarehouse
While single transaction chains display each function call in
the stack that generated an event, the multi-transaction chain
consolidates function calls by name, even if their signatures are
different. For example, this call stack:
will display this single chain showing all four calls to
StoreAnswers():
but will display this multi-transaction chain, because all calls
to StoreAnswers() have been grouped together:
The Multi-request Chaining Wizard (is a pop-up window which
provides users with ability to open particular events from possible
event groups. Users can access this window in 2 ways:
by clicking on a chain node in the 'Multi Transaction' view of
the 'Distributed Chains' tab. In this case, the view wizard will
display corresponding events from same group as was clicked
on.
by clicking on a chain link on a stack frame in the 'Event
Properties' tab. In this case, the view wizard will display events
from the opposite group. For example, if the user opens a client
event and clicks on a chain link the wizard will perform a search
for the corresponding server events. Alternatively, f the user
opens a server event and clicks on a chain link the wizard will
perform a search for the corresponding client events.
The first page contains short description of the target event
group and has two radio buttons:
Show all events – This
selection redirects to the last page, and shows all matching events
that fit within the selected event date +/- 1 week that have the
same event type (performance/exception)
Filter events – This selection
allows users to specify several filter parameters: Computers,
Source, Date From, Date To, Min Duration and Max Duration. Then the
user is redirected to the last page which shows all results that
match the filtering conditions
The last page of the wizard displays the list of possible
events to select from with the following format:
Troubleshooting performance counters are collected continuously
within a 15 minute window. When a .NET exception or performance
event occurs, all performance counter data from the 15 minute
window leading up to the event are captured and stored.
To enable/disable troubleshooting performance
counters, or to change the collection window:
Open the Intercept Management Console
Right-click the 'Applications' node
Choose 'Properties' from the menu
Go to the 'Performance Counters' tab
To view the performance counters:
Open SE-Viewer
Select the 'Events' dashboard
Open the event details for a performance event
Open the 'Performance Counters' tab
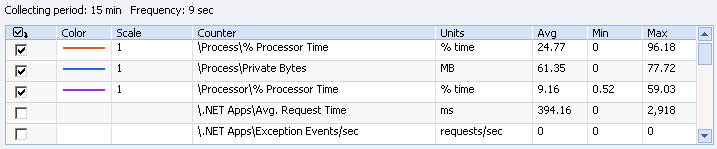
By default, details for the collection period are displayed
for:
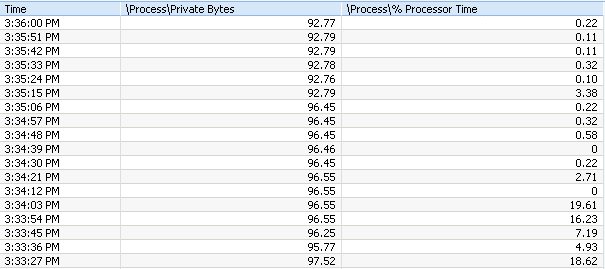
Process\Private Bytes: This
counter indicates the current number of bytes allocated to this
process that cannot be shared with other processes. This counter is
used for identifying memory leaks.
Process\%Processor Time: This
counter is the primary indicator of processor activity. High values
many not necessarily be bad. However, if the other
processor-related counters are increasing linearly such as %
Privileged Time or Processor Queue Length, high CPU utilization may
be worth investigating.
Process\ID Process: ID Process
is the unique identifier of this process. ID Process numbers are
reused, so they only identify a process for the lifetime of that
process.
Process\Virtual Bytes: Virtual
Bytes is the current size, in bytes, of the virtual address space
the process is using. Use of virtual address space does not
necessarily imply corresponding use of either disk or main memory
pages. Virtual space is finite, and the process can limit its
ability to load libraries.
Processor\% Processor Time: %
Processor Time is the percentage of elapsed time that the processor
spends to execute a non-Idle thread. It is calculated by measuring
the duration of the idle thread is active in the sample interval,
and subtracting that time from interval duration. (Each processor
has an idle thread that consumes cycles when no other threads are
ready to run). This counter is the primary indicator of processor
activity, and displays the average percentage of busy time observed
during the sample interval. It is calculated by monitoring the time
that the service is inactive, and subtracting that value from
100%.
Network Interface\Bytes
Total/sec: Bytes Total/sec is the rate at which bytes are
sent and received over each network adapter, including framing
characters. Network Interface\\Bytes Received/sec is a sum of
Network Interface\\Bytes Received/sec and Network Interface\\Bytes
Sent/sec.
LogicalDisk\% Free Space: %
Free Space is the percentage of total usable space on the selected
logical disk drive that was free.
.NET Apps\Monitored
Requests/sec: The total number of requests each second that
are being processed by .NET applications configured for operations
monitoring. This counter is incremented when the request triggers
an entrypoint configured for the process.
.NET Apps\Exception Events/sec:
This counter records the total number of exception events
generated. The number of events recorded by this counter is based
on the agent configuration, critical vs. all exceptions, customized
exception handlers, etc. This counter may be larger than the number
of exception events reported to SE-Viewer, because it also includes
events that are suppressed by Event Throttling.
.NET Apps\Performance
Events/sec: This counter records the total number of
performance events generated. The number of events recorded by this
counter is based on the agent configuration, threshold levels,
enabled namespaces, etc. This counter may be larger than the number
of performance events reported to SE-Viewer, because it also
includes events that are suppressed by Event Throttling.
.NET Apps\Avg. Request Time:
The average time (in seconds) that it takes for a request to be
processed by .NET applications configured for operations
monitoring. The timing of each request begins from when it triggers
an entrypoint configured for the process, and is stopped when the
request completes successfully or fails somewhere in the code. The
sum of these times is averaged across the total number of requests
being monitored. If this time consistently exceeds the alerting
threshold , it indicates a bottleneck that should be investigated.
. This counter is only available when AVIcode Operations Monitoring
is enabled.
.NET CLR Memory\# Bytes in all
Heaps: This counter is the sum of four other counters; Gen 0
Heap Size; Gen 1 Heap Size; Gen 2 Heap Size and the Large Object
Heap Size. This counter indicates the current memory allocated in
bytes on the GC Heaps.
.NET CLR Memory\% Time in GC:
This counter indicates the percentage of elapsed time spent
performing a garbage collection since the last garbage collection
cycle. The most common cause of a high value is making too many
allocations, which may be the case if you are allocating on a
per-request basis for ASP.NET applications. You need to study the
allocation profile for your application if this counter shows a
higher value.
.NET CLR Memory\# Gen 0
Collections: This counter indicates the number of times the
generation 0 objects are garbage-collected from the start of the
application. Objects that survive the collection are promoted to
Generation 1. You can observe the memory allocation pattern of your
application by plotting the values of this counter over time.
.NET CLR Memory\# Gen 1
Collections: This counter indicates the number of times the
generation 1 objects are garbage-collected from the start of the
application.
.NET CLR Memory\# Gen 2
Collections: This counter indicates the number of times the
generation 2 objects are garbage-collected from the start of the
application. The generation 2 heap is the costliest to maintain for
an application. Whenever there is a generation 2 collection, it
suspends all the application threads. You should profile the
allocation pattern for your application and minimize the objects in
generation 2 heap.
.NET CLR Memory\Allocated
Bytes/sec: This counter displays the number of bytes per
second allocated on the garbage collection heap. This counter is
updated at the end of every garbage collection, not at each
allocation. This counter is not an average over time; it displays
the difference between the values observed in the last two samples
divided by the duration of the sample interval.
Network Interface\Output Queue
Length: Output Queue Length is the length of the output
packet queue (in packets). If this is longer than two, there are
delays and the bottleneck should be found and eliminated, if
possible. Since the requests are queued by the Network Driver
Interface Specification (NDIS) in this implementation, this will
always be 0.
.NET CLR Exceptions\# of Exceptions
Thrown/sec: This counter displays the number of exceptions
thrown per second. These include both .NET exceptions and unmanaged
exceptions that get converted into .NET exceptions e.g. null
pointer reference exception in unmanaged code would get re-thrown
in managed code as a .NET System.NullReferenceException; this
counter includes both handled and unhandled exceptions. Exceptions
should only occur in rare situations and not in the normal control
flow of the program; this counter was designed as an indicator of
potential performance problems due to large (>100s) rate of
exceptions thrown. This counter is not an average over time; it
displays the difference between the values observed in the last two
samples divided by the duration of the sample interval.
Memory\Available Bytes:
Available Bytes is the amount of physical memory, in bytes,
immediately available for allocation to a process or for system
use. It is equal to the sum of memory assigned to the standby
(cached), free and zero page lists. For a full explanation of the
memory manager, refer to MSDN and/or the System Performance and
Troubleshooting Guide chapter in the Windows Server 2003 Resource
Kit.
Memory\Pages/sec: Pages/sec is
the rate at which pages are read from or written to disk to resolve
hard page faults. This counter is a primary indicator of the kinds
of faults that cause system-wide delays. It is the sum of
Memory\\Pages Input/sec and Memory\\Pages Output/sec. It is counted
in numbers of pages, so it can be compared to other counts of
pages, such as Memory\\Page Faults/sec, without conversion. It
includes pages retrieved to satisfy faults in the file system cache
(usually requested by applications) non-cached mapped memory
files.
This area also displays the average, minimum and maximum values
that occurred during the collection period (5 minutes in this
example). To display other counters, select the checkbox next to
the counter(s) of interest, and select the 'Apply' button.
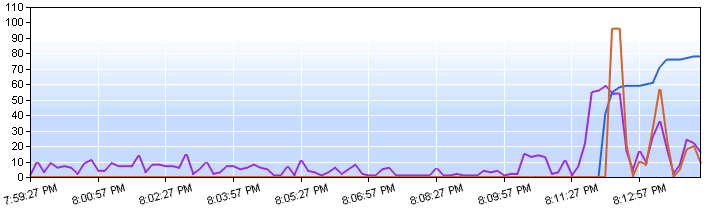
Diagram View
The diagram view displays counter values across a 10 minute
interval, with each counter displayed in a unique color. The
selection area (above) also serves as the color key for this
table.
Table View
The table view display counter values for the last 10 minutes in
intervals of 'Frequency' (set to 3 seconds in this example). To
change the collection frequency:
Open the Intercept Management Console
Right-click the 'Applications' node
Choose 'Properties' from the menu
Go to the 'Performance Counters' tab
Enter the interval in seconds into the Collection Frequency
field.
The monitoring agent can send events without detail information.
These events are called as "light" events, and a message will be
shown in the event details window indicating that details are not
available. A link allows user to see similar events which are not
light and have event details.
Notice the the 'Similar events' tab has a checkbox to
include/exclude light events in the list.
Last update: Thursday, December 09, 2010
02:02:24 PM
 Examples for
performance event details are given for ASP.NET applications and
web services. Note that this information applies to any .NET
components monitored by AVIcode products.
Examples for
performance event details are given for ASP.NET applications and
web services. Note that this information applies to any .NET
components monitored by AVIcode products.
 )
symbol to expand structures such as class (
)
symbol to expand structures such as class ( ), functions (
 ), arrays (
 ), and objects (
 ). The minus (
 ) symbol will collapse the information
displayed.
) symbol will collapse the information
displayed. ) to show details related to parameters
and member variables, and the up arrows (
) to show details related to parameters
and member variables, and the up arrows ( ) to reduce the level of detail
displayed. Dagnosing performance issues only requires
information about the dialog between your application and external
resources.
) to reduce the level of detail
displayed. Dagnosing performance issues only requires
information about the dialog between your application and external
resources.
 Where's the
first call the performance stack trace? Because the stack shows
how calls were executed across time, the stack is displayed with
the first function executed at the top, and the last function
executed at the bottom.
Where's the
first call the performance stack trace? Because the stack shows
how calls were executed across time, the stack is displayed with
the first function executed at the top, and the last function
executed at the bottom. This symbol
links to details about the next connected event node in the chain
for performance events.
This symbol
links to details about the next connected event node in the chain
for performance events. This symbol
links to details about the event node that preceded this
performance event in the chain.
This symbol
links to details about the event node that preceded this
performance event in the chain.
 'Table View'
or graphically in a
'Table View'
or graphically in a  'Diagram View'.
 'Problem' from the 'Similar by:' dropdown list
 )
) 'Heaviest Resource' from the
'Similar by:' dropdown list
'Heaviest Resource' from the
'Similar by:' dropdown list
 : fits the graph
to the window
: fits the graph
to the window : resizes the
graph to its default size
: resizes the
graph to its default size : reduce the size
of the picture
: reduce the size
of the picture
 This number
must be at least 30 seconds.
This number
must be at least 30 seconds.