 Examples for
performance event details are given for ASP.NET applications and
web services. Note that this information applies to any .NET
components monitored by AVIcode products.
Examples for
performance event details are given for ASP.NET applications and
web services. Note that this information applies to any .NET
components monitored by AVIcode products.Examples for
performance event details are given for ASP.NET applications and
web services. Note that this information applies to any .NET
components monitored by AVIcode products.
The 'Event Properties' tab provides property information about the event such as what computer the event occurred on, the Event Date, etc. The Properties tab also displays event data that allows you to drill down the call stack, and view such detailed information as parameters and member variables.
The properties area displays all non-data related information about an exception or performance event.
The event type icon (![]() ,
, ![]() ,
, ![]() ) is also displayed below the General
Information area and to the right of the tabs to indicate whether
you are looking at a performance event, handled exception or
critical exception. The icon will also display a tooltip with event
ID and event category.
) is also displayed below the General
Information area and to the right of the tabs to indicate whether
you are looking at a performance event, handled exception or
critical exception. The icon will also display a tooltip with event
ID and event category.
This area
will only appear for exceptions that fall within either the
Security or Connectivity aspects.
Generally, exceptions that occur from either Security or Connectivity problems fail with a description that contains the name of the failed function, but with little useful context for troubleshooting the issue. Intercept Studio is able to intelligently interpret the exception data to display a more useful description of the problem, and to provide additional context targeted to troubleshooting the issue.
 This symbol
identifies the Target, or subject, of an operation. For example, if
the operation attempts to open a registry key, then the target is
the registry key being opened. If it is a SQL query, then SQL is
the target. For file I/O operations, the filename is the
target.
This symbol
identifies the Target, or subject, of an operation. For example, if
the operation attempts to open a registry key, then the target is
the registry key being opened. If it is a SQL query, then SQL is
the target. For file I/O operations, the filename is the
target.
 Actions -
 Actions are the actual methods executed as the result of
a user requested action such as File.Open or the text of a SQL
query that results in a Security or Connectivity failure.
(exceptions)
Actions -
Actions - Actions are the actual methods executed as the result of
a user requested action such as File.Open or the text of a SQL
query that results in a Security or Connectivity failure.
(exceptions)
 Security
Context - The Security context provides the connection string (for
database connections) and the user that the ASP.NET process is
running under.
Security
Context - The Security context provides the connection string (for
database connections) and the user that the ASP.NET process is
running under.
This area displays all of the places where the exception was caught and re-thrown between where the error occurred (highlighted in red) and where the call was initially made.
Use the plus ( )
symbol to expand the chain. The minus (
)
symbol to expand the chain. The minus ( ) symbol will collapse the chain.
Clicking on any of the exceptions in the chain will reload the Exception Data Area with information specific to that exception.
This area provides the data that can be exposed through the exception itself, including various structures and public properties.
Use the plus ()
symbol to expand structures such as class ( ), functions (
 ), arrays (
 ), and objects (
 ). The minus () symbol will collapse the information
displayed.
). The minus () symbol will collapse the information
displayed.
The 'Stack' section of the screen displays all function and resource calls that are relevant to the cause of the event.
All exception events display the stack trace displaying where the exception was thrown. Operational exception events also display where the exception was caught and handled:
Use the plus ()
symbol to expand structures such as class (), functions (), arrays (), and objects (). The minus () symbol will collapse the information
displayed.
Use the down arrows ( ) to show details related to parameters
and member variables, and the up arrows (
) to show details related to parameters
and member variables, and the up arrows ( ) to reduce the level of detail
displayed. Diagnosing performance issues only requires
information about the dialog between your application and external
resources.
) to reduce the level of detail
displayed. Diagnosing performance issues only requires
information about the dialog between your application and external
resources.
When you expand a bottom level function call () in the Stack area using the
down arrows (),
SE-Viewer will display a tabbed box that will allow you to
view parameters, member variables and source code for the
expanded function.
Note that the stack frame where the exception occurred is highlighted in red as indicated below:
 Where's the first
call the exception stack trace? Because the stack shows how the
exception was raised through the calling functions, the stack is
displayed with the first function executed at the bottom, and the
last function executed at the top.
Where's the first
call the exception stack trace? Because the stack shows how the
exception was raised through the calling functions, the stack is
displayed with the first function executed at the bottom, and the
last function executed at the top.
 The 'Show complete call stack' menu item is available when
viewing exception events. It will display every call on
the stack back trace, including Microsoft or System frames not
directly related to the application. By default, the display only shows stack
frames directly related to the cause of the exception. Frames not
directly called by the application are displayed in gray.
The 'Show complete call stack' menu item is available when
viewing exception events. It will display every call on
the stack back trace, including Microsoft or System frames not
directly related to the application. By default, the display only shows stack
frames directly related to the cause of the exception. Frames not
directly called by the application are displayed in gray.
 The
'Show parameters' menu item is available when viewing exception
events. It displays the parameter names and types for each function
call in the stack.
The
'Show parameters' menu item is available when viewing exception
events. It displays the parameter names and types for each function
call in the stack.
 The 'Show
lines' menu item is available when viewing exception events. It
will display the fully qualified path name of the source code file
that the function is defined in, as well as the line number at
which that definition appears. It also allows the function offsets
(see below) to be displayed.
The 'Show
lines' menu item is available when viewing exception events. It
will display the fully qualified path name of the source code file
that the function is defined in, as well as the line number at
which that definition appears. It also allows the function offsets
(see below) to be displayed.
Function Offsets appear at the end of each stack frame, which permit using Ildasm.exe to locate the actual line of code that corresponds to that frame
 Intercept
Studio allows you to see exception events propagated from the
server-side to the client-side through chains. If an event is
generated for both tiers, you will be able to click on the chain
icon to see the corresponding event on the other tier.
Intercept
Studio allows you to see exception events propagated from the
server-side to the client-side through chains. If an event is
generated for both tiers, you will be able to click on the chain
icon to see the corresponding event on the other tier.
 This symbol
links to details about the event node that will receive this
exception as a result of the call.
This symbol
links to details about the event node that will receive this
exception as a result of the call.
 This symbol
links to details about the event node that an exception was
received from.
This symbol
links to details about the event node that an exception was
received from.
Example:
Event #45300 is from a client running 'QuestionnairePage.aspx', that displays the following exception chain:
By opening the exception data, we can see that the error actually occurred on the server-side when it was unable to process a request:
The stack shows that the exception was caught in the 'GetRootId()' immediately following the call to 'GetRootId()' in the 'Questionnaire.asmx' web service on the server:
To see what happened on the server-side, click on the
link, and
Intercept Studio will link to the corresponding event.
link
again.Event #45299 is the server-side event that corresponds to the 'GetRootId()' call from event #45300.
If we look at the exception chain, we see that the primary exception was a result of calling the OldeDbConnection.Open() method on the server-side:
If we look further down to the bottom of the exception chain, we also see a 'System.NullReferenceException', which is the exception that was propagated back to the client-side as a SoapException.
No exception chains to
the remote server? Be sure to check the synchronization of
times between your servers for each tier so that Intercept Studio
can properly correlate transactions for the chain functionality.
Also make sure that the related events exist on both tiers.
Once you drill down to the bottom frame of an exception event
through the
links, you will see a tabbed area that links you to detailed
information about function parameters, member variables and
the source code.
 The
The
 icon is
provided next to each frame that contains details about function
parameters and member variables. Click the symbol to open the frame to view the
details.
icon is
provided next to each frame that contains details about function
parameters and member variables. Click the symbol to open the frame to view the
details.
Note that the 'Parameters' label on the tab tells you how many
parameters there are for this function, in this case two (2).
Notice that by using the plus () symbols that you can drill further into the
details about the member variables and their values. The structure
column identifies whether or not each item is a class. Each
of these parameters matches those displayed in the function call in
number, type and order.
Once you drill down to the bottom frame of an exception event
through the
links, you will see a tabbed area that links you to detailed
information about function parameters, member variables and the
source code.
The
icon is
provided next to each frame that contains details about function
parameters and member variables. Click the symbol to open the frame to view the
details.
Note that the 'Member Variables' label on the tab tells you how
many member variables there are for this function, in this case
seven (7). Notice that by using the plus () symbols that you can drill further into the
details about the member variables and their values. The structure
column identifies whether or not each item is a class.
Once you drill down to the bottom frame of an exception event
through the
links, you will see a tabbed area that links you to detailed
information about function parameters, member variables and the
source code.
The
 icon is provided
next to each frame that contains details about source code. Click
the symbol to
open the frame to view the details.
icon is provided
next to each frame that contains details about source code. Click
the symbol to
open the frame to view the details.
The  Assembly area at the top of the tab provides detailed information
about the assembly in which the exception occurred. Information
includes: The name of the assembly, the last date modified, the
assembly path and the symbols path.
Assembly area at the top of the tab provides detailed information
about the assembly in which the exception occurred. Information
includes: The name of the assembly, the last date modified, the
assembly path and the symbols path.
If your PDB files are available on the Monitored System, SE-Viewer will also display several lines of source code around the line that cause the event to occur. This information includes the line number of the failed function call, Several lines of code surrounding the highlighted line of code in question and the file name where the function source code resides. This name is also a link, which when clicked, will bring you to the those lines of code in Visual Studio .NET
Source
code information is available for exceptions, but not for
performance events. At most, the information includes
the name of the file, the line number of the function call,
and several lines of code around the function call.
No source code in your events?
In order to allow SE-Viewer to display file names and
line numbers, you must have your PDB files installed on the
Monitored System. If there is not a PDB file available, you will
see:
Open the Source Code in Visual Studio .NET
The name of the file with the exception on the Source tab is a link that will open your Visual Studio solution file to the exact line of code with the issue. Simply click on the link and browse to the appropriate solution file:
Link to your source code
doesn't work? You must have the following in order for this
link to function correctly:
In order to allow SE-Viewer to display file names and line numbers, you must have your PDB files installed on the Monitored System. A program database (PDB) file holds debugging and project state information that allows incremental linking of a Debug configuration of your program. Installing PDB Files on your Monitored System will allow SE-Viewer to display file names and line numbers related to a particular defect.
To create your application's PDB Files for release versions:
![]() Configuration Properties
Configuration Properties
![]() Build
Build
For private DLLs, the PDB Files must reside in the same folder as the DLLs on the monitored system.
Installing the Visual Studio Plug-in
 'Tools' menu from the main SE-Viewer menu bar
 'Download wizard...' menu item
Using the Visual Studio Plug-in
You must have both Visual Studio .NET and the Intercept Plug-in installed on your machine in order to drill down to the line of source code that caused an event.
 ) to
show details related to parameters and member
variables.
) to
show details related to parameters and member
variables.The Module List area displays which modules were loaded in memory at the time the event occurred.

The module data includes the module name, date modified, assembly path and symbols path.
Use the plus ()
symbol to expand information about each module. The minus
() symbol will
collapse the information displayed.
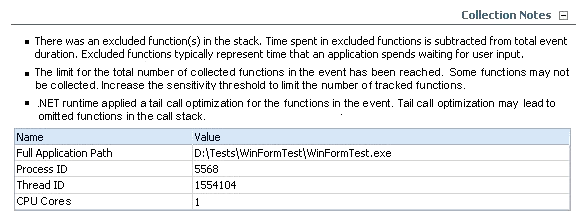
Collection notes provide additional data about any restrictions that apply to the event. If restrictions are in effect, the Collection Notes area will be open and visible when the event details are opened.
This tab may be used to find similar events that are occurring in your system. You may filter for identical events, events where the exception occurred in the same place, events that failed with the same exception class or events that have the same function at the bottom of the call stack.
The properties area provides selection criteria for filtering how many and what type of similar events you wish to view.
The event list area will display links to all similar events in
a  'Table View'
or graphically in a
'Table View'
or graphically in a  'Diagram View'.
Grouping exception events by 'Problem' means that all events are identical and have the same call stack.
 'Problem' from the 'Similar by:' dropdown list
 ))
'Diagram View' link at the bottom of the page to view a bar chart
which will compare the number of events from this problem against
the number of events from other problems for the selected time
period.
))
'Diagram View' link at the bottom of the page to view a bar chart
which will compare the number of events from this problem against
the number of events from other problems for the selected time
period.Find similar events by Where the Exception Occurred
Grouping exception events by 'Action' means that all events had the same root node (where the exception occurred in the stack), e.g. a button click, page load, etc.
 'Action' from the 'Similar by:' dropdown list))
'Diagram View' link at the bottom of the page to view a bar chart
which will compare the number of events from this action against
the number of events from other actions for the selected time
period.
'Action' from the 'Similar by:' dropdown list))
'Diagram View' link at the bottom of the page to view a bar chart
which will compare the number of events from this action against
the number of events from other actions for the selected time
period.Find similar events by Exception Class
Grouping exception events by 'Exception Class' means that all events threw the same exception, e.g. System.NET.WebException, System.NullReferenceException, System.Data.SqlClient.SqlException, etc.
 'Exception Class' from the
'Similar by:' dropdown list))
'Diagram View' link at the bottom of the page to view a bar chart
which will compare the number of events from this exception class
against the number of events from other exception classes for the
selected time period.
'Exception Class' from the
'Similar by:' dropdown list))
'Diagram View' link at the bottom of the page to view a bar chart
which will compare the number of events from this exception class
against the number of events from other exception classes for the
selected time period.Find similar events by the function at the bottom of the call stack
Grouping exception events by 'Failed Function' means that all events had the same function at the bottom of the call stack, e.g. System.Web.HttpApplication.ExecuteStep, ThrowsSoapException(), Microsoft.Samples.Client.Main, etc.
 'Failed Function' from the 'Similar
by:' dropdown list))
'Diagram View' link at the bottom of the page to view a bar chart
which will compare the number of events from this failed function
against the number of events from other failed functions for the
selected time period.
'Failed Function' from the 'Similar
by:' dropdown list))
'Diagram View' link at the bottom of the page to view a bar chart
which will compare the number of events from this failed function
against the number of events from other failed functions for the
selected time period.This tab may be used to find events from an event log that are related to this exception event. To tie event log events to your application:
The properties area provides time criteria for filtering how many related events you wish to view.
The event list area will display links to all related events. Click on any of the links to view the details for that event.
The Distributed Chains Tab provides a graphical display of all applications, and their related Web Service and .NET Remoting calls, associated with a client-side business transaction.
The properties area displays information about the events which are displayed in the graphical chain.
Troubleshooting performance counters are collected continuously within a 15 minute window. When a .NET exception or performance event occurs, all performance counter data from the 15 minute window leading up to the event are captured and stored. To enable/disable troubleshooting performance counters, or to change the collection window:
By default, details for the collection period are displayed for:
Memory\Pages/sec
This area also displays the average, minimum and maximum values that occurred during the collection period (5 minutes in this example). To display other counters, select the checkbox next to the counter(s) of interest, and select Apply.
The diagram view displays counter values across a 10 minute interval, with each counter displayed in a unique color. The selection area (above) also serves as the color key for this table.
The table view display counter values for the last 10 minutes in intervals of 'Frequency' (set to 3 seconds in this example). To change the collection frequency:
This number must be at least 30
seconds.
Last update: Thursday, December 09, 2010 02:08:27 PM