The 'Computers' dashboard is accessible via the tab on the lower left
side of the main SE-Viewer window. Data will automatically
load when the tab is selected based on any search/filter criteria
that may have been set previously for other tabs.
The computers configuration view provides configuration
information about each monitored server in your network, including
information about what agent versions are currently installed and
the agent's monitoring configuration. Computers are added to the
list after an agent is installed and a heartbeat is sent to
SE-Viewer. The agent will send a configuration event when the
performance monitor starts and at intervals thereafter. This
event contains information about all monitored applications
on the computer and the agent version. SE-Viewer will update the
computer configuration with the new information. Any computer that
does not send any information within the expected time period is
displayed in a gray font. Any computer which does not send a
configuration event within 7 days is deleted from the list.
The table contains:
Computer Name: The name of the
monitored server and domain that it resides in
Windows Version: The version of
the operating system running on the monitored server and any
applied service packs
Agent Version: The version
number of the AVIcode agent installed on the monitored server
Collection Frequency (sec):
This value is the [x] second
interval at which state performance counters are collected and
reported to SE-Viewer.
Last Update: The last time a
state packet was received
Monitored Process / Name: This
column displays the name Web
Applications to indicate that applications running under IIS
are actively being monitored. Listed within the Web Applications table cell are the names of all
web applications that have been specifically configured for
monitoring in the Intercept Management Console. Other table cells
in this column include the names of all executables, Windows
services and COM+ applications which have been configured for
monitoring in the Intercept Management Console. Any application
which has monitoring disabled will not appear in this table.
Monitored Process / Monitor:
This column displays the currently configured monitor for the
listed process name. It displays:
Alerting=[x] for the alerting
threshold
Sensitivity=[x] for the
Sensitivity Threshold
Type= either all or
unhandled, to indicate whether all
exceptions will be collected or just the critical, unhandled
ones
This view
displays the last configuration saved on each server, and does not
necessarily reflect that actual monitoring state. Configuration
changes do not take effect from the Intercept Management Console
unless IIS is restarted/recycled (for web applications) or the
application is restarted (for executables, Windows Services and
COM+ applications).
By clicking on the name of any computer in the list, you can
access computer resource utilization information. Read more about
available resource utilization data below.
Any filters
currently set in the SE-Viewer pane will be applied to data
displayed on this dashboard. Once a user drills down into
information for a specific computer however, the filters are no
longer applicable.
The Computer Resource Utilization view allows IT personnel to
see how hardware resources are being utilized by multiple
applications hosted on the server. Based on the information
provided in this view, administrators can see the most overloaded
server from an application standpoint and start investigating to
pinpoint which application is having the biggest impact on the
resources being utilized. The outcome of this activity might be
provisioning dedicated hardware for the application, improved load
balancing schema or initiating application optimization
activities.
Usage Scenarios
Detect CPU pegged servers and analyze if it is due to
application activity
CPU related issues can happen due to the activity of the
monitored applications (processes), non-monitored applications
(processes) or monitoring infrastructure.
To see if CPU starvation issues are due to application activity
you can compare the total CPU time spent for all monitored
processes vs. the total CPU time.
If the problem is due to application activity it may be from
high volume of transactions or intensive calculations.
A high number of transactions may be the result of increased
user population. A resolution could be the addition of new load
balanced hardware.
Intensive calculations may surfaced due to min/avg./max
transaction time data. A resolution could be an analysis of
collected events and application optimization.
To see if CPU related issues are due to monitoring impact you
can derive it from the total number of events/exceptions
analyzed/sent by the monitoring Agent.
If the problem is due to monitoring activity, a resolution is
to implement more aggressive event throttling, event criticality
definition, alerting/sensitivity threshold tuning
Detect servers that are close to running out of memory and
analyze if the reason is application activity
Memory related issues can happen because of memory leak,
increased volume of users/transactions, processing of unusually big
data sets (import/export of huge files for example)
To see if memory starvation issues are related to a monitored
application you can compare the total allocated memory vs. total
managed/unmanaged memory for all monitored processes.
A memory leak in an application could be detected by comparing
trends for process memory utilization (managed/unmanaged),
transaction counts, user population.
If the number of users/transactions stays the same, but the
application memory footprint increases, then most likely the
application leaks memory. A resolution is to start memory dump data
collection.
If the number of users/transactions grows, and the application
memory footprint grows somewhat linearly to the transaction growth,
then a resolution is to spread the load among more hardware.
Processing of large data sets by an application that cases a
memory problem cannot be proactively monitored, but can be detected
when the application fails with 'out of memory' exceptions.
Detect high I/O activity (including network, disk, and other
devices) and analyze if the reason is application activity
Unusual I/O utilization could be a result of increased
transaction/user population level or processing of big
datasets.
To see if I/O consumption issues are related to monitored
applications you can compare total I/O bytes/sec vs. monitored
applications bytes/sec.
If the I/O level is high when transaction level is low it
potentially indicates transfers of big data sets over the
wire/disks
Detect if there are network connectivity issues between
application users and the server
Unusually low number of monitored
transactions/user connections to the server may indicate that the
server is no longer accessible by the end users or some
applications are not serving client requests.
By clicking on the name of any computer in the list, you can
access computer resource utilization information for that monitored
server. Read more about available resource utilization data
below.
State performance counters are used to monitor the immediate
health state of monitored applications by collecting a snapshot of
configured performance counters at 5 minute intervals. This
interval is configurable by:
Open the Intercept Management Console
Right-click the 'Applications' node
Choose 'Properties' from the menu
Go to the 'Performance Counters' tab
Enter the interval in seconds into the Collection Frequency
field.
This number
must be at least 30 seconds.
The Applications dashboard
displays statistics and load trends for applications that are
currently running. The information is collected across the previous
one hour window for the selected server, and displays both the
average and last values collected for:
.NET Apps\Avg. Request Time:
The average time (in seconds) that it takes for a request to be
processed by .NET applications configured for operations
monitoring. The timing of each request begins from when it triggers
an entrypoint configured for the process, and is stopped when the
request completes successfully or fails somewhere in the code. The
sum of these times is averaged across the total number of requests
being monitored. If this time consistently exceeds the alerting
threshold, it indicates a bottleneck that should be investigated. .
This counter is only available when AVIcode Operations Monitoring
is enabled.
.NET Apps\Monitored
Requests/sec: The total number of requests each second that
are being processed by .NET applications configured for operations
monitoring. This counter is incremented when the request triggers
an entrypoint configured for the process.
ASP.NET Apps\Requests Queued:
The number of requests currently queued. In IIS 6.0, this
indicates a shortage of worker threads. Requests are rejected when
ASP.NET\Requests Current exceeds the requestQueueLimit (default = 5000) attribute for
<processModel> element defined
in the Machine.config file. This can happen when the server is
under very heavy load. The queue between IIS and ASP.NET is a named
pipe through which the request is sent from one process to the
other. When running in IIS 6.0, there is a queue where
requests are posted to the managed thread pool from native code.
There is also a queue for each virtual directory. You should
investigate the ASP.NET Applications\Requests In Application Queue
and ASP.NET\Requests Queued to investigate performance issues.
ASP.NET Apps\Requests/Sec: The
throughput of the ASP.NET application on the server. It is one the
primary indicators that help you measure the cost of deploying your
system at the necessary capacity.
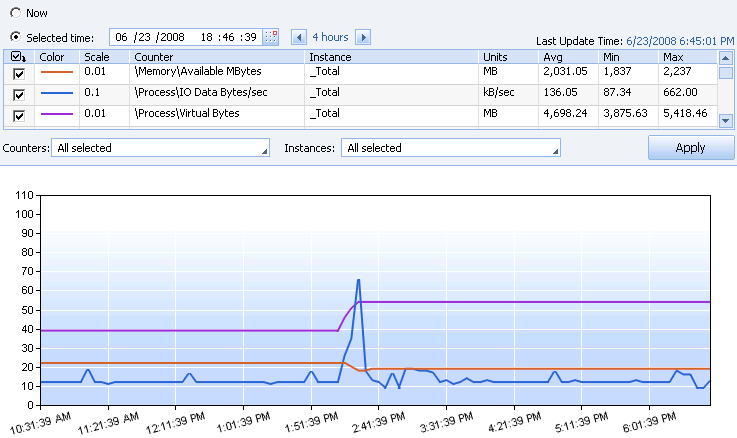
Memory\Available MBytes: This
counter indicates the current number of bytes allocated to this
process that cannot be shared with other processes. This counter is
used for identifying memory leaks.
Process\IO Data Bytes/sec:
Shows the rate at which the process is reading and writing bytes in
I/O operations. This counter counts all I/O activity generated by
the process to include file, network and device I/O's.
Process\Private Bytes: Shows
the current number of bytes that this process has allocated that
cannot be shared with other processes.
Process\Virtual Bytes: Shows
the current size, in bytes, of the virtual address space that the
process is using. Use of virtual address space does not necessarily
imply corresponding use of either disk or main memory pages.
Virtual space is finite, and by using too much, the process can
limit its ability to load libraries.
Processor\% Processor Time:
This counter is the primary indicator of processor activity. High
values many not necessarily be bad. However, if the other
processor-related counters are increasing linearly such as %
Privileged Time or Processor Queue Length, high CPU utilization may
be worth investigating.
Processor\% .NET Apps Time: A
calculated value displaying how much of the processor time is being
spent running .NET applications.
Web Service\Current
Connections: The number of current client connections to the
W3Svc Service.
All of the
'Processor\' counters are calculated values based on values
collected for the corresponding 'Process\' values. Because the
'Process' values can exceed 100% (i.e. the maximum values can reach
[100% * Number-of-CPUs]), they
cannot easily be compared to counters with a maximum of 100%. By
dividing the 'Process' values by the number of monitored CPUs
provides a value that does not exceed 100% and can be directly
compared to other counters on the same scale.
Data may be displayed either for the past hour (by selecting the
'Now' radio button at the top of the
screen), or for any hour leading up to a 'Selected time' (by
selecting the 'Selected time' radio
button and choosing from the date menu).
The first reading
of data after a worker process is started will not be displayed.
Since all data is averaged across all worker processes, starting
any new worker process will prevent data from being sent about
processes that have been running for any time period. Similarly,
any worker process that IIS automatically unloads after being idle
for the configured time period will invalidate all counters for
that period.
Trend reports allow you to track various performance counters
across the last 10 sampling periods for:
.NET Apps\Avg. Request Time:
The average time (in seconds) that it takes for a request to be
processed by .NET applications. The timing of each request begins
from when it triggers an entrypoint configured for the process, and
is stopped when the request completes successfully or fails
somewhere in the code. The sum of these times is averaged across
the total number of requests being monitored. If this time
consistently exceeds the alerting threshold, it indicates a
bottleneck that should be investigated.
.NET Apps\Monitored
Requests/sec: The total number of requests each second that
are being processed by .NET applications configured for operations
monitoring. This counter is incremented when the request triggers
an entrypoint configured for the process.
ASP.NET Apps\Requests Queued:
The number of requests waiting to be processed.
Memory\Available Bytes:
Available Bytes is the amount of physical memory, in bytes,
immediately available for allocation to a process or for system
use. It is equal to the sum of memory assigned to the standby
(cached), free and zero page lists. For a full explanation of the
memory manager, refer to MSDN and/or the System Performance and
Troubleshooting Guide chapter in the Windows Server 2003 Resource
Kit.
Process\IO Data Bytes\sec: The
rate at which the process is reading and writing bytes in I/O
operations. This counter counts all I/O activity generated by the
process to include file, network and device I/Os.
Process\Private Bytes: This
counter indicates the current number of bytes allocated to this
process that cannot be shared with other processes. This counter is
used for identifying memory leaks.
Process\Virtual Bytes: Virtual
Bytes is the current size, in bytes, of the virtual address space
the process is using. Use of virtual address space does not
necessarily imply corresponding use of either disk or main memory
pages. Virtual space is finite, and the process can limit its
ability to load libraries.
Process\%Processor Time: This
counter is the primary indicator of processor activity. High values
many not necessarily be bad. However, if the other
processor-related counters are increasing linearly such as %
Privileged Time or Processor Queue Length, high CPU utilization may
be worth investigating.
Processor\%.NET Apps Time: A
calculated value displaying how much of the processor time is being
spent running .NET applications. This value is averaged across the
number of CPUs on the monitored server.
Web Service\Current
Connections: Current Connections is the current number of
connections established with the Web service.
The first reading
of data after a worker process is started will not be displayed.
Since all data is averaged across all worker processes, starting
any new worker process will prevent data from being sent about
processes that have been running for any time period. Similarly,
any worker process that IIS automatically unloads after being idle
for the configured time period will invalidate all counters for
that period.
This screen displays all of the ASP.NET worker processes that
are currently being monitored.
Applications: The applications
that are running under the ASP.NET process responsible for either
an application pool or an executable or service.
PID: The process ID of the
monitored process
Framework: What version of the
.NET framework the ASP.NET worker process is running under.
Application Pool: For processes
running applications under IIS, what application pool are they
associated with
The first reading
of data after a worker process is started will not be displayed.
Since all data is averaged across all worker processes, starting
any new worker process will prevent data from being sent about
processes that have been running for any time period. Similarly,
any worker process that IIS automatically unloads after being idle
for the configured time period will invalidate all counters for
that period.
State performance counters are used to monitor the immediate
health state of an application by collecting a snapshot of
configured performance counters at 5 minute intervals. The
Applications dashboard displays
statistics and load trends for applications that are currently
running. The information is sampled every 300 seconds (5 minutes)
by default. To change this setting:
Open the Intercept Management Console
Right-click the 'Applications' node
Choose 'Properties' from the menu
Go to the 'Performance Counters' tab
Enter the interval in seconds into the Collection Frequency
field.
This number
must be at least 30 seconds.
Applications that are displayed in gray have not reported any
data for the past hour. Applications that have not reported any
data for the past 7 days are removed from the list. No data is
reported for the first collection period after an application
starts.
The first reading
of data after a worker process is started will not be displayed.
Since all data is averaged across all worker processes, starting
any new worker process will prevent data from being sent about
processes that have been running for any time period. Similarly,
any worker process that IIS automatically unloads after being idle
for the configured time period will invalidate all counters for
that period.
Last update: Thursday, December 09, 2010
01:35:25 PM
 tab on the lower left
side of the main SE-Viewer window. Data will automatically
load when the tab is selected based on any search/filter criteria
that may have been set previously for other tabs.
tab on the lower left
side of the main SE-Viewer window. Data will automatically
load when the tab is selected based on any search/filter criteria
that may have been set previously for other tabs.
 This view
displays the last configuration saved on each server, and does not
necessarily reflect that actual monitoring state. Configuration
changes do not take effect from the Intercept Management Console
unless IIS is restarted/recycled (for web applications) or the
application is restarted (for executables, Windows Services and
COM+ applications).
This view
displays the last configuration saved on each server, and does not
necessarily reflect that actual monitoring state. Configuration
changes do not take effect from the Intercept Management Console
unless IIS is restarted/recycled (for web applications) or the
application is restarted (for executables, Windows Services and
COM+ applications).
 Any filters
currently set in the SE-Viewer pane will be applied to data
displayed on this dashboard. Once a user drills down into
information for a specific computer however, the filters are no
longer applicable.
Any filters
currently set in the SE-Viewer pane will be applied to data
displayed on this dashboard. Once a user drills down into
information for a specific computer however, the filters are no
longer applicable.