 tab on the lower left side of the
main SE-Viewer window. Data will automatically load when the
tab is selected based on any search/filter criteria that may have
been set previously for other tabs.
tab on the lower left side of the
main SE-Viewer window. Data will automatically load when the
tab is selected based on any search/filter criteria that may have
been set previously for other tabs.The Applications dashboard is
accessible via the tab on the lower left side of the
main SE-Viewer window. Data will automatically load when the
tab is selected based on any search/filter criteria that may have
been set previously for other tabs.
State performance counters are used to monitor the immediate health state of an application by collecting a snapshot of configured performance counters at 5 minute intervals. Application activity levels provide IT personnel with an overview of application performance, current user load, and performance counters that may indicate potential bottlenecks in the underlying hardware/software.
With the Applications State View, users can:
The Applications dashboard displays statistics and load trends for applications that are currently running. The information is sampled every 300 seconds (5 minutes) by default. To change this setting:
 This number
must be at least 30 seconds.
This number
must be at least 30 seconds.
Applications that are displayed in gray have not reported any data for the past hour. Applications that have not reported any data for the past 7 days are removed from the list. No data is reported for the first collection period after an application starts.
The arrow icons indicate whether the counts have gone up
( ) or down (
  ) since the last reporting
interval.
) since the last reporting
interval.
By clicking on the name of any application in the list, you can access application resource utilization information, including Key Metrics, Trend Reports, Computers and Topology. Read more about available resource utilization data below.

Any filters
currently set in the SE-Viewer pane will be applied to data
displayed on this dashboard. Once a user drills down into
information for a specific application however, the filters are no
longer applicable.
The Key Metrics tab provides an at-a-glance view of the selected application. The graph displays 1) the average performance based on the Monitored Requests counter, and 2) the number of requests. By looking at the graph, you can easily determine the traffic load, and make inferences about problems that may be occurring. For example, if the number of requests has dropped to zero, there may be firewall issues.

The Problem Group view on the Application Key Metric popup window contains a table with events grouped by problems with external, non-monitored components/resources (e.g. SQL), Within each problem group, the data is broken down further by aspect (security, connectivity, failures or performance).
The Key metrics tab will show all discovered dependencies for a monitored application. For each application topology tab on the dashboard, the application resource utilization will show:
 Internal execution time
 Database calls
(providers: SqlClient, OLEDB, ODBC, Oracle)
Database calls
(providers: SqlClient, OLEDB, ODBC, Oracle)
 SMTP
mail calls
SMTP
mail calls
 Web
Services calls
Web
Services calls
 Remoting
calls
Remoting
calls
 WCF calls
 COM+
calls
COM+
calls
Each connected application is clickable and opens an application resource screen for that application which allows users to analyze dependencies for that application.
Since
information is received from the Intercept Agent, only components
which have monitored resources will appear on the topology diagram.
If there were no exceptions or performance events, the resource
will not be presented on the diagram.

This view shows the last 10 security, connectivity, failures or performance events that occurred for the selected application.
 The first reading
of data after a worker process is started will not be displayed.
Starting any new worker process will prevent data from being sent
about processes that have been running for any time period.
Similarly, any worker process that IIS automatically unloads after
being idle for the configured time period will invalidate all
counters for that period.
The first reading
of data after a worker process is started will not be displayed.
Starting any new worker process will prevent data from being sent
about processes that have been running for any time period.
Similarly, any worker process that IIS automatically unloads after
being idle for the configured time period will invalidate all
counters for that period.
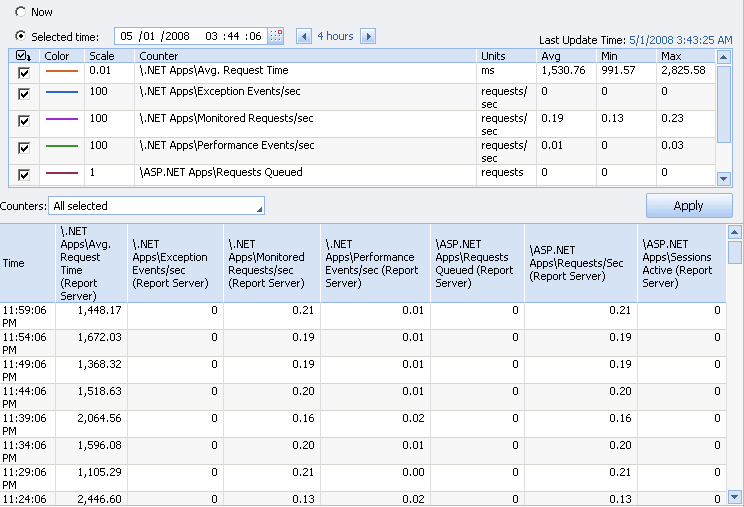
Trend reports allow you to track various performance counters across the last 10 sampling periods. You may choose from a list of counters, for which the following information is provided:
Two different data views are available:
 Diagram View:
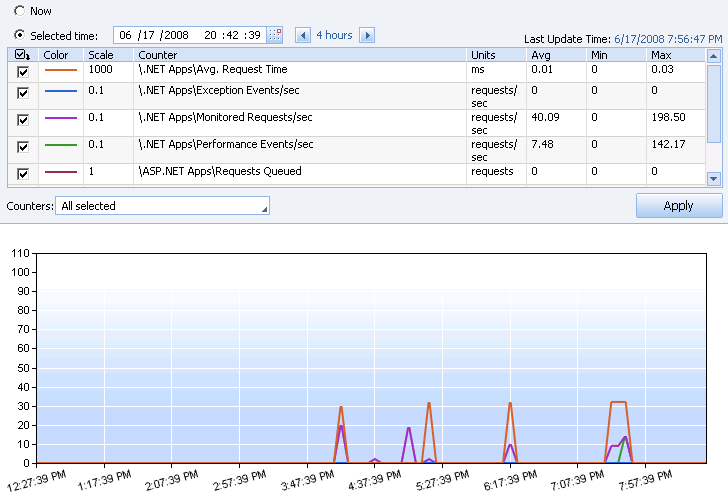
A dropdown list of all counters is provided to simplify selecting any, all or no counters:
 Table View:
The first reading
of data after a worker process is started will not be displayed.
Starting any new worker process will prevent data from being sent
about processes that have been running for any time period.
Similarly, any worker process that IIS automatically unloads after
being idle for the configured time period will invalidate all
counters for that period.
This view displays what computers an application is running on (particularly interesting in a load-balanced environment), along with information about the previous hour and the current load.
The first reading
of data after a worker process is started will not be displayed.
Starting any new worker process will prevent data from being sent
about processes that have been running for any time period.
Similarly, any worker process that IIS automatically unloads after
being idle for the configured time period will invalidate all
counters for that period.
This view displays a map of each enterprise application's components and how they are interconnected across the various application tiers. As events are received from each component, Intercept Studio is able to determine the component's location within the map and how it connects to other components. The topology map may be calculated for one day, two days, one week, two weeks, one month, two months or one year, depending on the 'For last' dropdown selection. The current accuracy of the map will depend on 1) whether events have been received by all components, and 2) whether the deployment architecture has changed within the selected 'For last' time period.
Each node in the topology map displays the name of the component and the number of events that have been collected for that component within the selected 'For last' time period.
Last update: Thursday, December 09, 2010 01:35:26 PM