This document describes the steps to perform in order to avoid excessive performance overhead from processing large numbers of time-only functions that are not exceeding the sensitivity threshold.
Assuming the following preconditions:
Processing for each time-only function requires that 2 calls be made to an API called QueryPerformanceCounter to get the time and logic to track information about the function during its execution. When the execution time of the function itself is very small, the additional monitoring logic creates noise that is very small in absolute value, but more than 100% relative to the function execution time itself. So if an application spends a lot of time executing time-only functions, a large performance degradation will be introduced.
There are a number of monitoring heuristics that help to determine whether time-only functions need to be processed or not. For example, if the throttling limit is reached for an entrypoint, or if an entrypoint was marked as light, then no functions inside that entrypoint will be processed.
But sometimes even these heuristics do not help and too many light time-only functions are processed and create noise on custom applications. The following sections of this document describe how to ensure that namespace monitoring will not introduce a large performance overhead for your applications.
When an application’s rate of processed time-only functions per second exceeds the defined limit, time-only function processing will be stopped. In order to avoid turning off counters as a result of localized spikes, the rate is calculated every 5 seconds instead of every second. The first two checks (10 seconds) for the process are skipped to prevent immediately disabling time-only processing when an application starts up under a stress load when the monitoring heuristics have not yet initialized.
When a high rate of time-only functions per second is detected, one of the following (depending on configuration settings) will occur:
If one of these things happens, the user will be notified by one of the following warnings in the event log:
Due to an unusually high system load, the threshold for functions processed per second has been exceeded. This may have resulted from time-only monitoring of a namespace with a large number of the functions. Please change your configuration settings to prevent this situation. Execution time monitoring for namespaces will be disabled.
Due to an unusually high system load, the threshold for functions processed per second has been exceeded. This may have resulted from time-only monitoring of a namespace with a large number of the functions. Please change your configuration settings to prevent this situation. All monitoring will be disabled.
The noise that time-only functions make for an entrypoint is calculated, and if the noise exceeds the entrypoint self-execution time then the processing of time-only functions for that concrete entrypoint is stopped. Information for the next call to the same entrypoint is collected. So if a performance event is sent from that entrypoint, it may contain fewer time-only functions than the number that actually exceeded the threshold for this entrypoint.
In this case the following informational message will be output to the event log:
Intercept Studio detected problem with your configuration settings. Time-only function monitoring of a resource has exceeded the allowable threshold. Some time-only functions will not be reported in the event for that resource until the resource is called again
and the entrypoint event will contain a note about the situation:
Some time-only functions cannot be collected due to performance optimizations. Please disable non-interesting namespaces from performance monitoring to prevent this from happening.
If the monitoring noise is large, but the count does not exceed the threshold, then the threshold for the counters need to be decreased.
There are two reasons why there may be a lot of noise but the threshold is not being reached:
In order to calculate the value specific to a particular workstation, you can do following:
<ss:globalTimonlyPerSecondThreashold enable="true" value="28303" mode="light"/>
These settings mean that the counter for time-only functions per second is enabled, and the limit is set to the calculated value. When this limit is reached then processing of time-only functions will be disabled.
In order to find out the actual values you need to do the following:
<ss:enableAgentDiagnostic value="true"/>
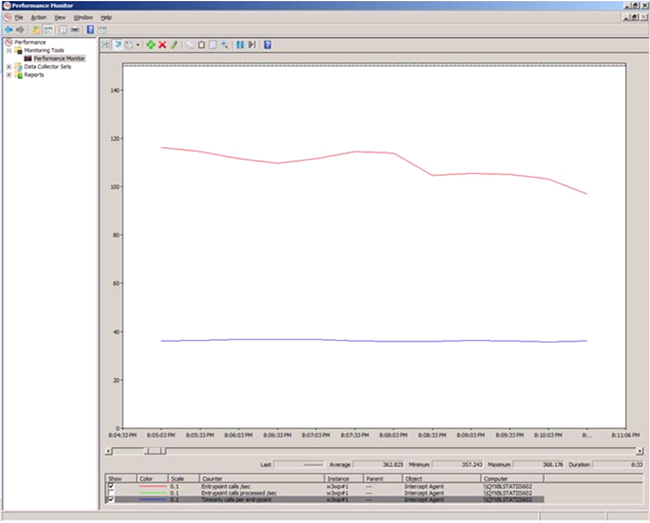
Intercept Agent/Avg timeonly calls per entrypoint = 362
Intercept Agent/Avg entrypoint calls / sec = 1088
<ss:globalTimonlyPerSecondThreashold enable="true" value="67456" mode="light"/>
If you need to tune the system based on both workstation and application behavior (see "" and ""), use an average of the values that were calculated for each.
From our examples in the previous sections, the globalTimonlyPerSecondThreashold value was set to:
|
28303 for the workstation |
|
67456 for the applications |
|
47879 is the average value |
<ss:globalTimonlyPerSecondThreashold enable="true" value="47879" mode="light"/>
If you know that there are some entrypoints that process an excessively large number of time-only functions, and time-only function processing is enabled for that entrypoint, you just need to increase the value of the allowable noise for time-only function processing.
The noise introduced for a function is the sum of the time for 2 QueryPerformanceCounter calls, because call one is made at the beginning of the function and one call is made at the end to measure the function's execution time. As we described under "", the noise introduced into the function by the 2 calls to QueryPerformanceCounter is 2 * 2603896/23/10 seconds. The default multiplier value (2) used inPMonitor.config assumes that the call to QueryPerformanceCounter is the longest operation. But sometimes, depending on environment characteristics and namespaces, the noise of each time-only function can be more. In those cases the multiplier value used to calculate noise needs to be increased.
Note that QueryPerformanceCounter is a non-deterministic counter, and may or may not exceed the threshold under similar circumstances. That is, it can work differently for same entrypoint in different environments. Processing of time-only functions for an entrypoint is stopped when the noise of the time-only functions became more than the execution time of the entrypoint itself.
<ss:timeonlyNoisePerEntrypoint enable="true" value="8"/>
Namespaces that should be disabled can be found by the following methods:
The main goal of event analysis is to disable monitoring of :
If you already have events from Intercept Studio, open an event and try to understand which namespaces/functions are not interesting for performance degradation root-cause analysis. Usually 3rd party components are not very interesting and should be disabled.
In order to find out which time-only functions are extremely
fast by event analysis, you need to set the sensitivity threshold
for the application to 0. You can do this without an application
restart.  Note: Switching the sensitivity threshold to 0 can harm application
performance. So be careful with this in a production
environment.
Note: Switching the sensitivity threshold to 0 can harm application
performance. So be careful with this in a production
environment.
Intercept Studio will not collect time-only functions after the counter threshold has been reached. But you can temporarily override this functionality by disabling the threshold.. Note: Do not leave the configuration setting for globalTimonlyPerSecondThreashold set to False.
<ss:globalTimonlyPerSecondThreashold enable="false".../>.
Note: Keep in mind that
the best practice is to leave this setting at "true" and to modify
the settings described in previous sections instead. If you do
change this setting to false, do not
forget to change it back after the event analysis.Function tracing allows you to determine which functions are experiencing the most noise overhead.
Tracing allows you to understand the average call times for
functions.
Note: The logging functionality cannot be used in a production
environment, because it can harm application performance.
If one of the limits was reached so that time-only monitoring becomes disabled, the problem is finding which functions caused the problem. In order to find these functions you need to do following to set the printThreshold to "1" to print out ever function that is executed:
|
<ss:functionTracingLog enable="true" name="logs\\flog.txt" sampleInterval="1" printThreshold="1" sampleCountPrintPeriod="5000" timePrintPeriod="300"/> |
The interesting information here is the function name1 and number of calls2:
5360; w3wp.exe; 2010-02-08T14:43:00; 73; 115; System.Runtime.Remoting.Proxies.RemotingProxy.InternalInvoke1; 2717720; 1002
The actual format of the message is the following:
|
<Process ID>; <Process Name>; <Log message time>; <Time Interval, sec>; <Total count of collected samples>; <Function name>; <Function ID>; <Count of collecting samples> |
Where:
|
Tag |
Meaning |
| <Process ID> | Process ID of the monitored application. Required to separate logs from different processes. |
| <Process Name> | Name of the monitored process. Required to separate logs from different processes. |
| <Log message time> | Time when the log was printed out. |
| <Time Interval, sec> | Interval of time when data was collected |
| <Total count of collected samples> | How many samples for that a function have been collected |
| <Function name>: | Function name. |
| <Function ID> | Unique function identifier. |
| <Count of collecting samples> | Number of samples of this function that were seen |
If there are a large number of functions with a large number of calls you need increase the sampling interval. It will speed up logging and preserve the statistical correctness of information that is logged. Depending on the data that you see in the log, set the sampling interval to a value of 10, 20 … 100. For example, if most of the calls in the previous section (trace log) have a <Count of collecting samples> equal to 100, then use 100 for the sampleInterval:
|
<ss:functionTracingLog enable="true" name="logs\\flog.txt" sampleInterval="100" printThreshold="1" sampleCountPrintPeriod="5000" timePrintPeriod="300"/> |
In order to decrease number of functions being output to the file you need to increase the value of printThreshold.
|
<ss:functionTracingLog enable="true" name="logs\\flog.txt" sampleInterval="50" printThreshold="20" sampleCountPrintPeriod="5000" timePrintPeriod="300"/> |
Now you will only see functions that were called statistically (printThreshold * sampleInterval) times during the timePrintPeriod.
In each of the last 3 steps you can define which namespaces or functions are not interesting for monitoring.
Usually non-interesting namespaces are:
You can generally detect these non-interesting functions by looking for:
Last update: Thursday, December 02, 2010 12:12:03 PM