 Maintenance


| State |
Maintenance |
Name |
|
|
HRWebService | |
|
|
JaggleInfoRetrieval | |
|
|
JaggleMatching |
FIGURE 9: The Distributed Applications View
 "Monitoring View"
 "Distributed Applications View"
An alternate way to view the application state is to navigate to:
"Monitoring View" "AVIcode .NET Application
Monitoring""Enterprise .NET Executable
Applications" (or Enterprise .NET Windows Services, Enterprise
ASP.NET Applications or Enterprise ASP.NET Web Services)"State
view"
"AVIcode .NET Application
Monitoring""Enterprise .NET Executable
Applications" (or Enterprise .NET Windows Services, Enterprise
ASP.NET Applications or Enterprise ASP.NET Web Services)"State
view"| State | Name | Path | Application Virtual Root | Alerting Threshold | Sensitivity Threshold | Monitor |
|
|
HRWebService | DEMO.COMPANY.COM | /LM/W3SVC/1/Root/HRWebService | 1000 | 1 | enabled |
|
|
JaggleInfoRetrieval | DEMO.COMPANY.COM | /LM/W3SVC/1/Root/JaggleInfoRetrieval | 10 | 2 | enabled |
|
|
JaggleMatching | DEMO.COMPANY.COM | /LM/W3SVC/1/Root/JaggleMatching | 100 | 50 | enabled |
FIGURE 9: The State View
The State View provides you with a real-time, consolidated snapshot of the overall state of your enterprise applications, highlighting the ones that require attention. State monitoring provides an administrator with the ability to understand, at a glance, the instantaneous health of the applications on their managed servers. IT managers can use the State option to provide senior executives with a concise overview of enterprise application health, which is particularly important for e-commerce and other critical business applications.
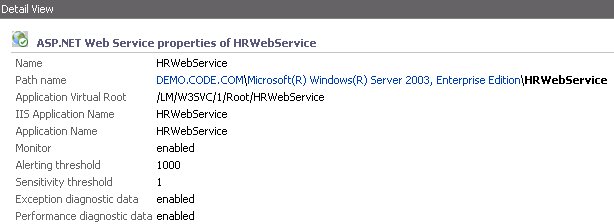
FIGURE 10: .NET Application Health at a Glance
The Management Pack discovers .NET applications running on the Monitored Computer at the moment the Management Pack receives the first event from an application. The management pack does this automatically and on-the-fly while monitoring the CLR for faults and slowdowns in applications running under IIS.
The State View provides a red /green indication of near real-time status of your ASP.NET, Web Services and .NET Remoting applications. A green light indicates a healthy state and red indicates critical.
Last update: Tuesday, June 08, 2010 03:19:09 PM